International Journal of Agriculture, Environment and Biotechnology
Citation: IJAEB: 13(1): 75-79, March 2020
DOI: 10.30954/0974-1712.1.2020.9
©2020 IJAEB All rights reserved
SOIL SCIENCE
Soil Nutrient Status of Gosani Block Under Gajapati District, Odisha
Rahul Adhikary*, Rohita Garnayak, Monisankar Bera and Arunabha Pal
Department of Soil Science and Agricultural Chemistry, M.S. Swaminathan School of Agriculture, CUTM, Gajapati, Odisha, India
*Corresponding author: rahul.adhikary@cutm.ac.in ( ORCID ID: 0000-0003-0020-4161)
Paper No.10
Received: 17-09-2019
Revised: 21-01-2020
Accepted: 22-02-2020
ABSTRACT
The present investigation was led during the year 2018-19 at Department of Soil Science and Agricultural Chemistry, M.S. Swaminathan School of Agriculture, Gajapati, Odisha with intend to consider supplement status of various village of Gosani square. The examples were gathered from various homesteads and towns of Gosani square. At that point test investigated according to standard strategy for surveying pH, EC, OC, and significant supplements like accessible nitrogen, phosphorous and potassium with micronutrients like zinc, copper, manganese and iron status of soils. The pH of soils changed from 6.13 to 6.44 and EC shifted from 0.06 to 0.34 dS/m. The natural carbon content in ranch soils was shifted from 0.35 to 0.55%. The accessible nitrogen, phosphorous and potassium ran from 125 to 250 and 31 to 41 and 185 to 542 kg/ha individually. The accessible zinc, copper, manganese and iron went from 1.08 to 2.92, 0.90 to 3.06, 9.96 to 27.90 and 17.02 to 74.14 mg/kg individually. The outcomes demonstrate that result were somewhat acidic in response, non-saline and low in natural carbon. The results were low to medium in accessible nitrogen and high in accessible phosphorous and medium to high in accessible potassium. The micronutrient status like accessible zinc was low to satisfactory and accessible copper, manganese; iron were sufficient sum found in soils. The outcomes presume that decent use of supplements required for fruitful harvest creation and advancement of vegetable in various villages under Gosani Block.
Highlights
 The present study was conducted to know about soil nutrient status of north East Ghats.
The outcomes demonstrate that result and it analyse with nutrient status both macro and micronutrients and its interpretation with accessible application.
Keywords: pH, EC, SOC, nutrients
The Gajapati district comes under "North Eastern Ghat Agro Climatic Zone" with light textured brown forest soil, which is highly acidic in nature. The geographical situation of the district is characterized by undulated topography with hilly terrain where the rain water is carried through hill streams & nallas in seven tribal blocks.
Most part of Gajapati district is covered with rugged forest and mountainous terrain of Eastern Ghats rocks with narrow inter mountain valleys. The average elevation of hills ranges from 500 to 1200 m above mean sea level. The important hills in the district are Dandamera Parbat (1103m), Tangiri Parbat (1155 m) and Mahendra Giri (1499 m). The area in and around Mohana, Chandragiri, Chandiput and Parlakhemundi constitute the pediment of undulating plains which have undergone ineightse weathering. Vansadhara River along with its tributaries e.g. Harbahangi, Badanadi & Mahendra Tanaya etc controls the overall drainage of the district which displays a dendritic patter.
The soil characteristics of the district show wide variation according to their physical and chemical properties, mode of origin & occurrences. Soils are having average to good fertility status.
MATERIALS AND METHODS
The area goes under ˝North Eastern Ghat Agro Climatic Zone˝ with light finished darker backwoods soil, which is profoundly acidic in nature (98% of soils are acidic in nature), The area of this region is restricted to Longitude 83 degree 48ˊ to 84 degree 7ˊ E and Latitude18 degree 46ˊ to 19 degree 9ˊ N, between Gopalpur (Odisha) to Kalingapatanam (AP) inside 48 km to 95 km from Sea shore (Sea coast). The topographical circumstance of the region is described by undulated geography with bumpy landscape where the downpour water is helped through slope streams and nallas in five inborn squares. The accompanying soil types are accessible in the region.
Alfisols or Red soil incorporate red sandy soils and red loamy soils of which red sandy soils are prominently accessible is practically all squares aside from in Parlakhemundi square which is described by red loamy soils. Alfisols are unbiased to marginally basic in nature having light surface permeable and friable structure without lime kankars. These are lacking in nitrogen, phosphate, natural issue and lime and are useful for paddy crops.
Entisols or Alluvial soil is more youthful in source inadequate in nitrogen, phosphoric corrosive and nearly wealthy in potash, lime and metal, antacid is nature. These are the most common type soils in the area.
Soil Sample Collection
Surface soil
Soil sampling grids of one sample/5km2areas were pre-determined systematically for each community block from revenue map. Twenty five numbers of surface soil samples collected from each block and sampling was done with the help of GPS (Global positioning system) instrument. Latitude and Longitude recorded for each soil sample. The soil samples were collected from 15 cm depth (Muhr et al. 1980) with the help of phourah.
A V-shaped cut made up to the plough layer and a uniform 1.5 cm thick slice taken out. The collected soil sample thoroughly mixed on a clean piece of polythene sheet, processed and kept it in plastic bottle with suitable description and identification code numbers.
Processing of Sample
Collected samples were brought to the laboratory spread out on paper. Leaves, Coarse concretions, stones, pieces of roots, and other un-decomposed organic residues were removed. Large lumps of moist soil were broken by hand. Samples were air dried at 20-25oC and 20% to 60% relative humidity inside the laboratory under shade. Samples were mixed during drying to expose bottom layer to top. After air drying soil samples were crushed gently with help of a wooden hammer and sieved through a 2 mm sieve. The material larger than 2 mm was discarded. They were stored with proper labelling in polythene bottles for analysis of physical, chemical & other properties.
Chemical properties
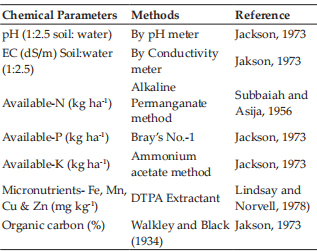
The soil samples were analyzed for the physical &chemical properties i.e. Soil pH, electrical conductivity, organic carbon, and available nutrient (N, P, K, Fe, Mn, Cu and Zn).
Table 1: Methods adopted for soil analysis
RESULTS AND DISCUSSION
Chemical properties
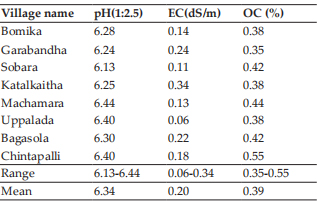
The pH of the soils ranges from 6.13 to 6.80 (Table 2) with mean estimation of 6.34. Among the soil samples tested, most of the soils were slightly acidic (97.40 %) followed by moderately alkaline (2.60 %).Most of the samples were slightly acidic in nature due to presence of acidic parent material like granite rock & igneous rock. The highest pH was found in Odapada block (7.83) followed by in Hindol block (7.72). Similar type of results was founded by Jena et al. (2008) in Deltaic alluvium in coastal Orissa.
Electrical conductivity (EC) of different soil tests of natural ranch were ranges from 0.06 to 0.47dS m-1with mean estimation of 0.20 dS m-1. The outcomes showed that every one of the soils are ordinary in nature and reasonable for a wide range of yields and for sound plant development because of the soils are liberated from saltiness. Comparable outcomes were also reviewed by Padole and Mahajan (2003) in swell-shrink soils of Vidharbha region.
Percentage of SOC content of the soils ranges from 0.32 to 0.55 (Table 2) with mean value of 0.39. Among the soil samples tested, most of the soils were low in organic carbon content due to long-term agriculture, Monocultures and intensive tillage. Soil Organic Carbon (SOC) SOC value of the distinct ranged between 0.09 to 1.87% with mean value of 0.66 %. This values were categorized under low (below 0.5%), medium (0.5 to 0.75%) and high (>7.5%) and the values under each village varies 0.32 to 0.55% respectively (Table 1). The results showed significant difference organic C content under each treatment over control. i.e., Jute geotextile contain more SOC over control plot by Adhikary et al. (2018).
Table 2: Chemical properties of soils in eight villages of Gosani block, Gajapati Districts
Macronutrient status of soils
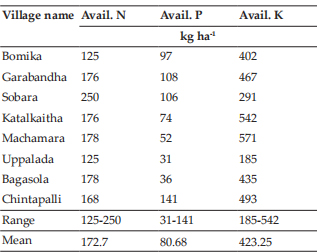
In this research table 3 displays the essential supplements status specifically accessible nitrogen, accessible phosphorus and accessible potassium which are required in huge amount for crop creation. Bomika, Garabandha, Sobara, Katalkaitha, Machamara, Uppalad, Bagasola, Chintapalli villages were low in accessible nitrogen content.
The most noteworthy (250 kg ha-1) accessible nitrogen content was found in Bomika village and least (125 kg ha-1) in Sobara village. Each of the eight villages of Gajapati region were low in mean accessible nitrogen content. Comparative outcome was likewise found by Mitra et al. The highest (250 kg ha-1) available nitrogen content was found in Nilakanthapur village and lowest (124 kg ha-1) in Gangapur village.
Available soil phosphorus content of Gosani block was found to vary in between 31 to 141 kg ha-1with a mean value of 84.5 kg ha-1 (Table 3). Highest soil available Phosphorus present in Chintapalli and lowest in Upallada village. The results clearly showed a gradual increase in average P content from upland to low land which could be attributed to the increased SOC in the low land than that of upland and medium land (as organic fractions of available phosphorus is mobilized to plant available form by the activity of microorganisms). Similar trends of available P were also observed by Barik et al. (2017).
Available soil Potassium content of Gosani block was found to vary in between185 to 542 kg ha-1with a mean value of 423.25 kg ha-1 (Table 3). Height potassium available at Katalkaitha village. The results clearly showed a average K content from all villages are high range which could be attributed to the increased clay content in that villages. It revealed that potassium ion being a cation present in the exchange site of negatively charged clay particles.
Table 3: Macronutrient status of soils (kg ha-1) in eight villages of Gajapati Districts
Micronutrient status of soil
The available iron in eight villages of Gajapati Districts was ranged from 17.20 to 74.14 mg kg-1with an average of 53.71 mg kg-1 (Table 4). All the soil samples collected from eight villages of Gajapati Districts were sufficient in available iron, as the critical limit of available iron is 4.5 mg kg-1 (Takkar et al. 1989).
Zinc The DTPA Zn result content of the soil reported in table 4 and Fig. 1. The table showed that DTPA Zn varied from 1.04-2.92 with mean value of 1.70 mg kg-1. Considering the of 0.6 mg kg-1 (Katyal, 1985) as critical limit of DTPA-Zn. It was found 26.66% soils were defined in Zn in the district. The maximum DTPA-Zn was seen in Katalkaitha village and minimum in Bagasola village. The parent material of the soil containing fewer amounts Zn. Which is further aggravated in surface due to light texture nature of the soil. White and Zasoski, 1999 found similar type of variation in micronutrient content in soils.
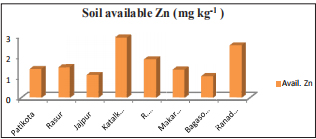
Fig. 1 : Soil available Zn status in eight villages in Gosani block
Table 4: Micronutrient status of soils (kg ha-1) in eight villages of Gajapati Districts
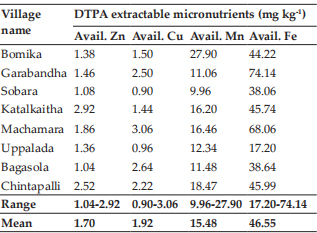
Copper DTPA extractable Cu content in soils ranged from 0.90-3.06 mg kg-1 with mean value of 1.9 mg kg4 in table 4 and Fig. 2. Considering the critical limit of 0.2 mg kg-1 for Cu for normal plant growth (Katyal and Randha 1985), the soils are rated adequate in available Cu Very few sample (0.3%) deficient in district. No Cu deficiency was observed in other villages. It was due to rich Cu bearing parent material of the soils.
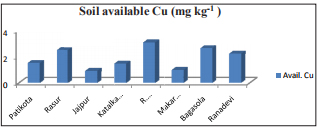
Fig. 2 : Soil available Manganese status in eight villages in Gosani block
Manganese The DTPA-Mn value in the soils of the district ranged between 9.96 to 27.90 mg kg-1 with an average value of 15.48 mg kg-1 reported in table 4 and Fig. 3. Considering the critical limit as 2 mg kg-1all soil samples of the district was found sufficient. It might be due to rich content of this element in soil forming parent material of this district. Similar results were found by Kumar et al. (2009).
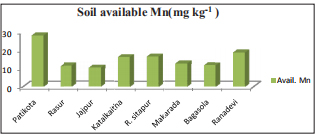
Fig. 3 : Soil available Manganese status in eight villages in Gosani block
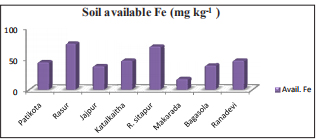
Fig. 4 : Soil available Fe status in eight villages in Gosani block
Iron DTPA extractable Fe content in these soils reported in table 4 and Fig. 4. It varied between 17.20 to 74.14 mg kg-1 with an average of 46.55 mg kg-1 considering the critical limit of 4.5 mg kg-1 for Fe (Lindsay and Norvell 1978); the soils are rated adequate in available Fe. In mid and low land rice growing is Fe toxicity was observed, due to high content of Fe.
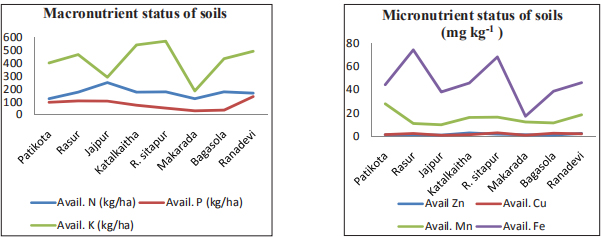
Fig. 5 : Macro and micronutrient status in Gosani block
CONCLUSION
From the above investigation it was discovered that the soils were somewhat acidic (100%) and nonsaline (100%). Soil natural carbon (SOC) substance of the examination territory was seen as low (70%), medium range (30%). Whole examination zone was seen as low in soil accessible nitrogen content (100%). The soils accessible phosphorus was seen as high (40%), medium (60%). Accessible potassium was seen as high range (100%). Whole examination zone was seen as medium to high in accessible micronutrient content. Hence, 25 per cent more fertilizers than that of the recommended dose should be applied in the soil having lower range of nutrients. In case of the soil of the village having higher status of nutrients, 25 per cent less fertilizers than that of the recommended dose should be applied. In the rest of the villages having medium range, recommended dose of fertilizers should be applied.
REFERENCES
Adhikary, R. and Ravi, L. 2018. Use of geotextiles for improving crop productivity on groundnut in Inceptisols. International Journal of Chemical Studies, 6 (5): 2673-2678.
Barik, R., Saren, S., Mishra, A. and Acharya, B.P. 2017. Soil fertility status of some villages in Astaranga bock of Puri District of East and South Eastern Coastal Plain Agro Climatic Zone of Odisha. Annals of Plant and Soil Research,19(4): 408-412.
Jackson, M.L.1973. Soil Chemical Analysis. Prentice Hall of India. Private limited, New Delhi.
Katyal, J.C. 1985. "Research achievements of all India coordinated scheme of micronutrients in soils and plants." Fertiliser News.
Kumar Rakesh, Sarkar, A.K., Singh, K.P., Agrawal, B.K. and Karmakar, S. 2009. Appraisal of available Nutrient Status in Santhal Paraganas Region of Jharkhand. Journal of the Indian Society of Soil Science, 57 (3): 366-369.
Lindsay, W.L. and Norvell, W.A. 1978. Development of DTPA soil test for Zn, Fe, Mn and Cu. Soil Science Society of America Journal, 42 : 421-428.
Maheshwar, M., Nayak, R.K. and Bandita Jena. 2018. Distribution of DTPA Extractable Micronutrients in Soils of Jajpur District, Odisha, India. Int. J. Curr. Microbiol. App. Sci., 7 (06): 2092-2096.
Mitra, S., Roy, A., Saha, A.R., Maitra, D.N., Sinha, M.K., Mahapatra, B.S. and Saha, S. 2010. Effect of integrated nutrient management on fiber yield, nutrient uptake and soil fertility in jute (Corchorus olitorius). Indian Journal of Agricultural Sciences, 80 (9): 801-804.
Muhr, G.R., Datta, N.P., Sankarasubramoney, H., Dever, F., Laley, V.K. and Donahue, R.L. 1980. Critical test values for available N, P and K in different soils. Soil Testing in India. 2nd ed. U.S. Agency for International Development, New Delhi, pp. 120.
Takkar, P.N. et al. 1989. Twenty Years of Coordinated Research on Micronutrients in Soils and Plants, Indian Institute of Soil Science, Bhopal IISS, Bulletin 1, pp. 394.
Tisdale, S.L., Nelson, W.L., Beaton, J.D. and Havlin, J.L. 1997. Soil Fertility and Fertilizers. 5th ed. MacMillan Publishing Co., New Delhi, 144: 198-201.
White, J.G. and Zasoski, R.J. 1999. Mapping soil micronutrients. Field Crops Research, 60 : 11-26.